Lake Water Testing and Monitoring
The Echo Lake Association is involved in the following Citizen Science programs:
Benthic Macroinvertebrate and IceWatch data are discussed on separate pages - click the links above to access the results for Echo Lake
Ontario Lake Partner Program (LLP)
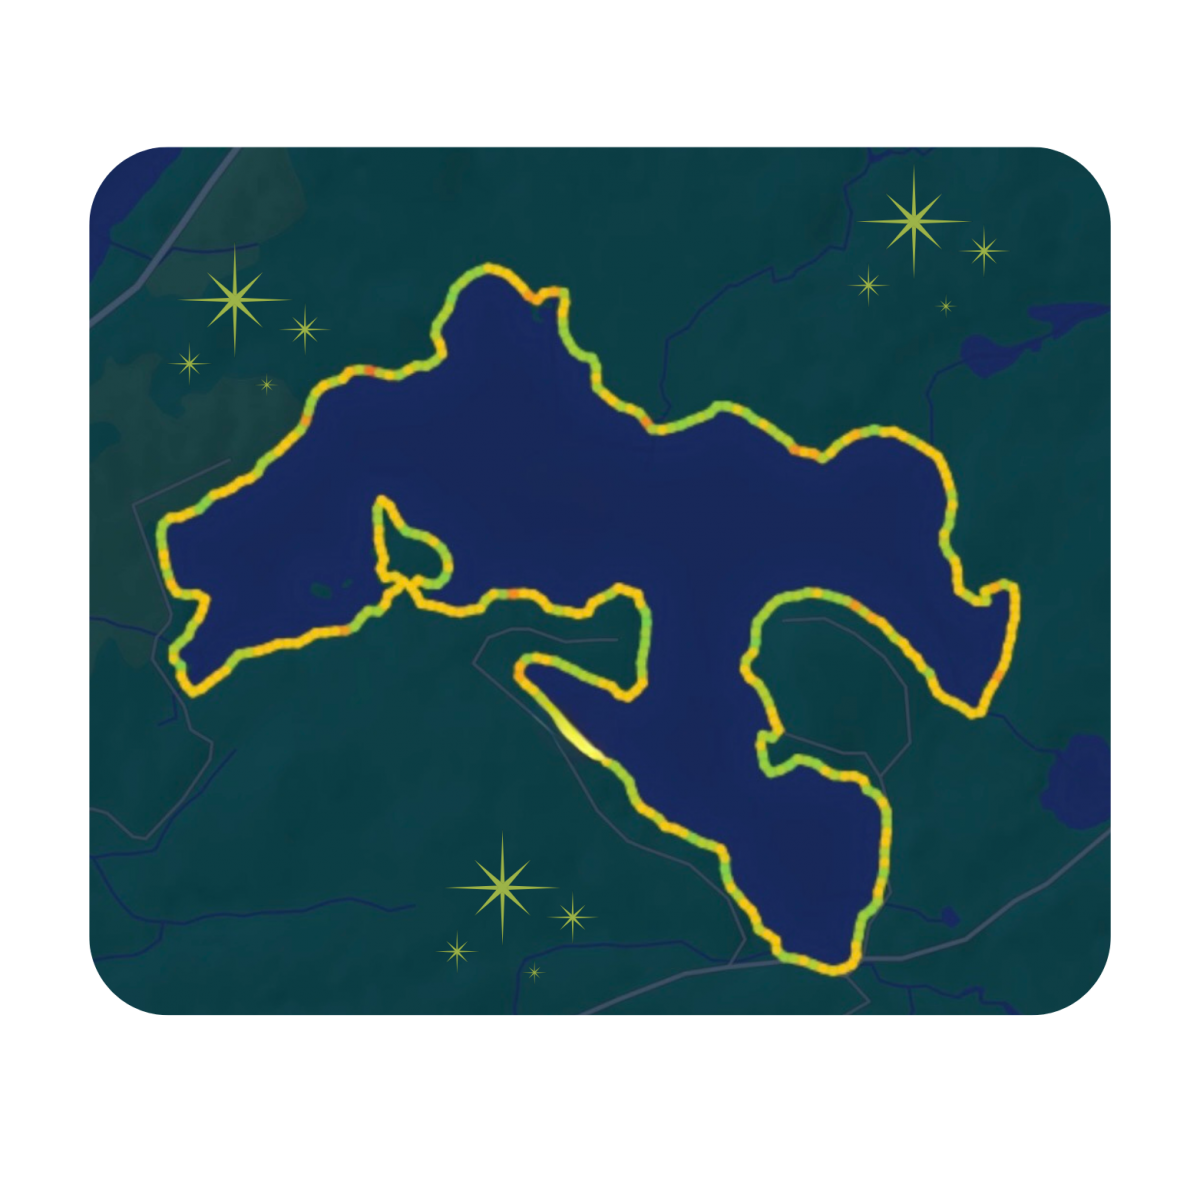
The Echo Lake Association has long been involved in the Ontario Lake Partner Program taking annual water samples to test for Phosphorous, and regular water clarity readings and temperature. The location of the sample point (the deepest part of the lake - 45 feet / 13.7 m) is marked on the map below.
LPP is an arrangement between the Federation Of Ontario Cottagers’ Associations (FOCA), and the Ontario Ministry of Environment, Conservation and Parks (MECP) to conduct water-quality testing - Samples are tested for total phosphorus, calcium, chloride, and water clarity. Datasets are released to the volunteers, the public, researchers and other scientists.
The Lake Partner Program was featured in the Spring 2026 edition of the North American Lake Management Society's publication, LakeLine. Click HERE to read or download the article by FOCA's Lake Stewardship Coordinator, Gavin Vance.
LPP is an arrangement between the Federation Of Ontario Cottagers’ Associations (FOCA), and the Ontario Ministry of Environment, Conservation and Parks (MECP) to conduct water-quality testing - Samples are tested for total phosphorus, calcium, chloride, and water clarity. Datasets are released to the volunteers, the public, researchers and other scientists.
The Lake Partner Program was featured in the Spring 2026 edition of the North American Lake Management Society's publication, LakeLine. Click HERE to read or download the article by FOCA's Lake Stewardship Coordinator, Gavin Vance.
To access complete LPP data for Echo Lake:
Living Lakes Canada - National Lake Blitz (COMPLETED)
Since 2023, the Echo Lake Association began participating in Living Lakes Canada’s National Lake Blitz program. This is a nationwide annual volunteer citizen science program that seeks to monitor water health: Air and water temperature, water clarity and PH testing. Datasets are used by WWF-CANADA for input to their Watershed Reports.
After 5 seasons of lake monitoring and community engagement across Canada, Living Lakes Canada has completed the National Lake Blitz project in 2025.
After 5 seasons of lake monitoring and community engagement across Canada, Living Lakes Canada has completed the National Lake Blitz project in 2025.
Muskoka’s Water Quality Monitoring Program
The District’s Water Quality Monitoring Program helps track the health of lakes across the region. The long-standing program monitors key indicators, such as phosphorus, calcium and chloride, to better understand long-term trends and help protect Muskoka’s lakes for future generations.
Around Muskoka, the results show that phosphorus levels remain below the bloom-risk threshold, but calcium levels continue to decline and chloride levels continue to rise.
This means that while the sampled lakes are currently safe from toxic algae outbreaks, their fundamental water chemistry is unraveling due to human impacts like road salt and acid rain.
Phosphorus is low (The Good News)
Phosphorus acts like a fertilizer for water. When there is too much of it (from agricultural runoff or sewage), it triggers massive, sometimes toxic blue-green algae blooms. Because levels are below the threshold, the water is currently safe from these dangerous algae spikes.
Calcium is dropping (The Bad News)
This is a phenomenon known as "aquatic osteoporosis." Decades of historical acid rain have leached calcium out of the surrounding soil, leaving less to wash into the water. Adding to the problem is that most lakes in Muskoka are located on the Canadian shield, where the calcium content in granite is already very low, resulting in little leaching of calcium back into the water.
Small aquatic creatures at the bottom of the food chain (like water fleas, or Daphnia) need calcium to build their protective shells. As calcium drops, these creatures die off, disrupting the entire food web and threatening fish populations.
Chloride is rising (The Ugly News)
This is a direct result of human pollution, most commonly from winter road salt (sodium chloride) or water softeners washing into watersheds. Chloride is toxic to freshwater life. As it rises, it creates a stressful, salty environment that kills off native species and allows salt-tolerant invasive species to take over.
ECHO LAKE:
- Our phosphorus level averages 8.3 mcg/L which is well below what the threshold is for algae bloom risk (to be clear, algae is a natural and necessary part of our ecosystem; it’s blue-green algae blooms that are problematic).
- Calcium averages 2.43 mcg/L and it’s been pretty steady over the years. Echo Lake has never fallen below 2 mg/L (at least in the years it’s been tracked since 2004).
- At an average of 3.48 mg/L, the Chloride level in Echo Lake is excellent.
- The Love Your Lake Program supports lake health assessments.
- The Natural Edge Program helps property owners naturalize their shorelines.
Using a combination of all of these water quality testing programs, the average results from 1997 to 2025 are:
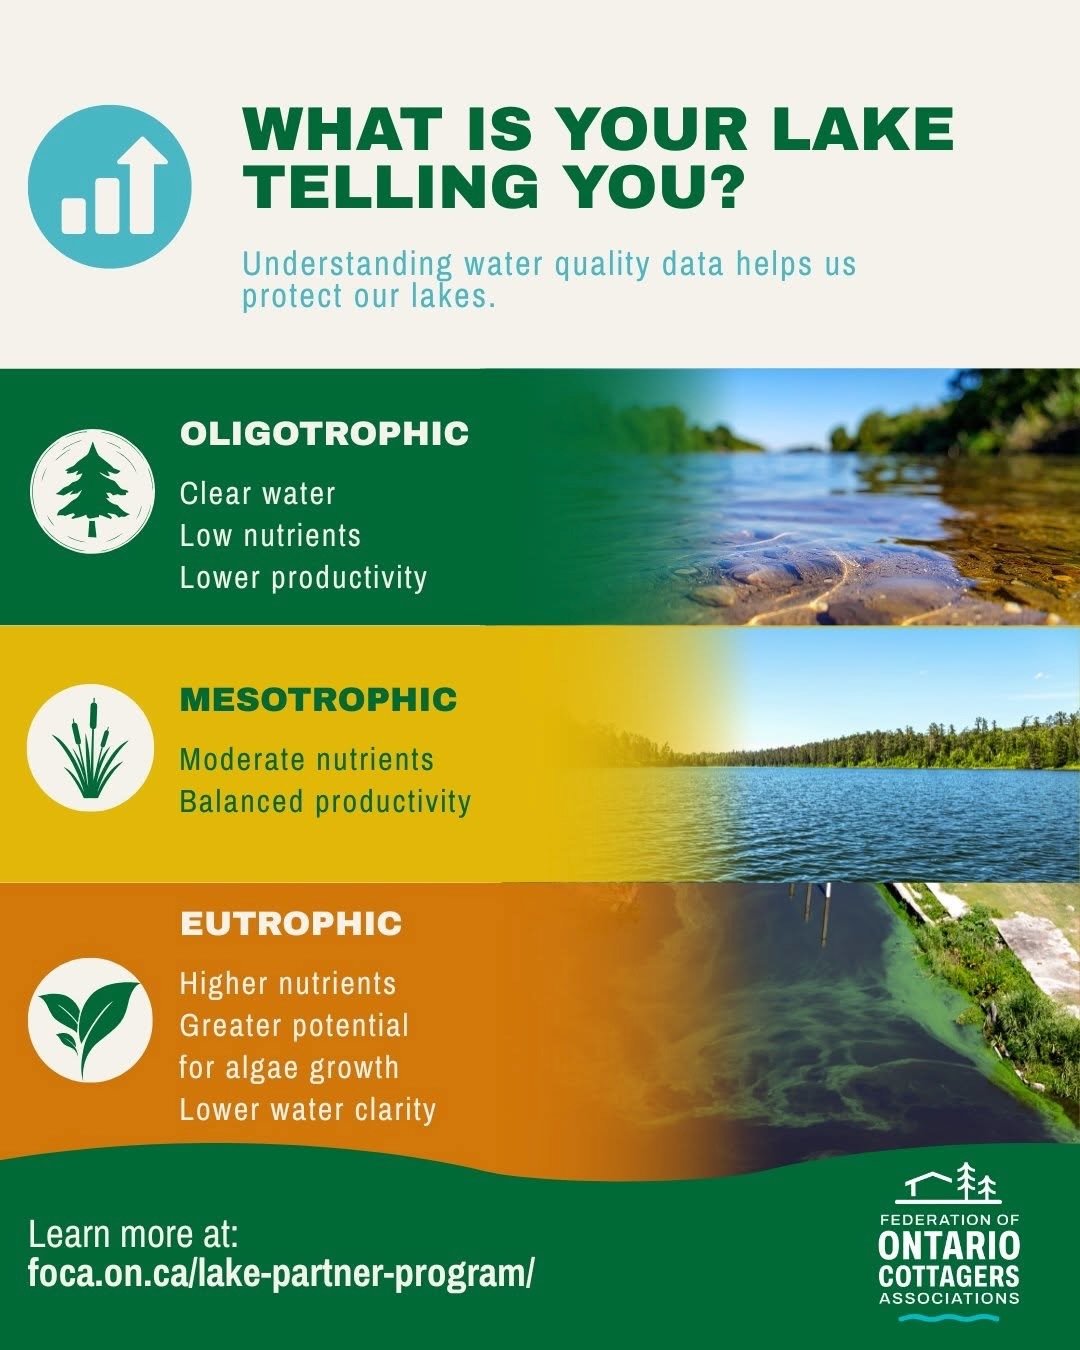
* Average Phosphorous = 8.3 micrograms/L >> Oligotrophic - OKAY
* Average Secchi Depth (Clarity) = 3.38m >> Mesotrophic - OKAY
Full Secchi disk and water temperature readings are listed below.
To learn more about trophic states visit: Limnology 101: Understanding Trophic States
NEW in 2025: Sulphate data
The average sulphate level in Echo Lake since 2018 is 2.13 mg/L (sulphate levels in Canadian lakes typically range from 3 to 30 mg/L). Why does this matter? Sulphate is a key indicator of acid precipitation. The lower the sulphate level, the better.
FYI: Echo Lake is considered VULNERABLE due to the blue-green algae bloom that occurred in 2019. That will continue to remain so.
While Echo Lake seems to be holding its own, we CANNOT REST ON OUR LAURELS!
To keep the lake healthy, our shorelines are our best defence. Think of the shoreline as the lake’s skin - natural shorelines protect the water by trapping excess nutrients and other damaging substances like fertilizers and other chemicals from entering the water.
Member Laura Murray, a long-time cottager on the lake who’s studied wildlife biology and has been surveying the loons for Birds Canada for at least 25 years, made some very important comments at our 2023 Annual General Meeting that bears repeating here:
If we do get another bloom, one of the worst things we can do is break them. The danger is when boats break them, that just spreads it out and that's where the toxicity really takes hold.
The best ways to protect the lake is not to use fertilizers, keep septic systems in good operation, don’t use antibacterial soap because that kills the natural biology of the lake, keep a natural shoreline (leave fallen trees, and create a good depth of a buffer zone between a lawn, if you have one, and the shoreline). This is our best plan against another blue-green algae bloom and will keep our lake healthy for generations.
Member Laura Murray, a long-time cottager on the lake who’s studied wildlife biology and has been surveying the loons for Birds Canada for at least 25 years, made some very important comments at our 2023 Annual General Meeting that bears repeating here:
If we do get another bloom, one of the worst things we can do is break them. The danger is when boats break them, that just spreads it out and that's where the toxicity really takes hold.
The best ways to protect the lake is not to use fertilizers, keep septic systems in good operation, don’t use antibacterial soap because that kills the natural biology of the lake, keep a natural shoreline (leave fallen trees, and create a good depth of a buffer zone between a lawn, if you have one, and the shoreline). This is our best plan against another blue-green algae bloom and will keep our lake healthy for generations.

Pin indicates sample location for temperature and water clarity.
| 2025 | Water Temperature (°C) @ 1m | Water Clarity | |
|---|---|---|---|
| May 20 | 15 | 3.95 m (12.9’) | |
| June 3 | 16 | 2.85 m (9.5’) | |
| June 16 | 22 | 2.93 m (9.6’) | |
| July 16 | 33 | 3.35 m (11.0’) | |
| August 4 | 28 | 3.30 m (10.8’) | |
| August 13 | 29 | 3.90 m (12.8’) | |
| September 11 | 22 | 3.35 m (11.0’) | |
| 2024 | Water Temperature (oC) @ 1m | Water Clarity | |
| May 16 | 23 | 4.10 m (13.5’) | |
| June 20 | 26 | 3.60 m (11’8"’) | |
| June 26 | 28 | 2.65 m (8’7”) | |
| July 12 | 27 | 2.93 m (9’6”) | |
| July 22 | 25 | 2.85 m (9’4”) | |
| July 31 | 30 | 2.95 m (9’7”) | |
| August 13 | 24 | 3.35 m (11’) | |
| August 22 | 26 | 2.65 m (8’7”) | |
| November 28 | 1 | 2.45 m (8’0") | |
| 2023 | Water Temperature (°C) @ 1m | Water Clarity | |
| May 6 | 11 | 3.4 m (11' 4") | |
| May 29 | 20 | 4.3 m (14' 3") | |
| June 18 | 23 | 2.4 m (8' 0") | |
| July 7 | 25 | 2.9 m (9' 6") | |
| July 19 | 25 | 2.1 m (7' 0") | |
| August 11 | 24 | 2.6 m (8' 6") | |
| August 28 | n/a | 3.05 m (10') | |
| November 9 | n/a | 2.44 m (8') | |
| 2022 | Water Temperature (°C) @ 1m | Water Clarity | |
| May 22 | 18 | 2.9 m (9' 6") | |
| June 24 | n/a | 2.8 m (9' 1") | |
| July 19 | n/a | 3.2 m (10' 5") | |
| August 14 | n/a | 3.3 m (10' 10") | |
| August 26 | n/a | 3.4 m (11' 2") | |
| October 24 | 13 | 2.5 m (8'1")? | |
| 2021 |
Water Temperature (°C) @ 1m | Water Clarity | |
| May 24 | 18 | 3.3 m (11' 0") | |
| June 6 |
22 |
3.3 m (10' 11") |
|
| July 4 | 23 | 2.6 m (8' 6") | |
| September 11 | n/a | 2.7 m (8' 10") | |
| October 20 | 17 | 2.8 m (9' 2") | |
| 2020 | Water Temperature (°C) @ 1m | Water Clarity | |
| May 23 | 17 | 3.1 m (10' 3") | |
| June 4 | 19 | 3.7 m (12' 1") | |
| June 28 | 22 | 2.4 m (8' 0") | |
| September 11 | 18 | 3.2 m (10' 6") | |
| September 20 | 14 | 3.0 m (9' 10") | |
| November 9 | 8 | 2.9 m (9' 7") | |
| 2019 | Water Temperature (°C) @ 1m | Water Clarity | |
| May 16 | 12 | 2.8 m (9' 1") | |
| June 6 |
16 | 4.1 m (13' 5") | |
| June 23 | 23 | 3.6 m (12') | |
| July 22 |
26 | 3.8 m (12' 6") | |
| August 11 |
22 | 3.4 m (11' 2") | |
| August 26 |
24 | 2.8 m (9' 1") | |
| 2018 | Water Temperature (°C) @ 1m | Water Clarity | |
| May 12 | 13 | 3.3 m (10' 8") | |
| June 10 | 22 | 2.6 m (8' 6") | |
| June 17 | 24 | 2.9 m (9' 7") | |
| July 12 | 26 | 3.3 m (10' 11") | |
| July 23 | 25 | 2.5 m (8' 3") | |
| August 19 | 26 | 4.3 m (14' 1") | |
| 2017 | Water Temperature (°C) @ 1m | Water Clarity | |
| May 17 | 16 | 3.1 m (10' 1") | |
| June 3 | 18 | 3.1 m (10' 3") | |
| July 2 | 23 | 2.5 m (8' 1") | |
| July 27 | Not able to attain | 2.8 m (9' 3") | |
| September 21 | Not able to attain | 3.1 m (10' 2") | |
| 2016 | Water Temperature (°C) @ 1m | Water Clarity | |
| May 12 | 15 | 3.3 m (10' 9") | |
| July 6 | 24 | 4.2 m (13' 10") | |
| August 1 | N/A | 4.4 m (14' 7") | |
| September 16 | 16 | 3.9 m (12' 9") | |
| September 25 | 14 | 4.1 m (13' 6") | |
| 2015 | Water Temperature (°C) @ 1m | Water Clarity | |
| May 24 |
17 | 2.3 m (7' 8") |
|
| June 20 |
21 | 2.9 m (9' 6') |
|
| July 6 |
22 | 3.2 m (10' 5") |
|
| August 22 |
24 | 3.1 m (10' 2") |
|
| November 29 | 3 | 2.6 m (8' 6") |
|
| 2014 | Water Temperature (°C) @ 1m | Water Clarity |
|
| June 7 |
21 | 2.7 m (8' 11") |
|
| July 10 |
22 | 3.3 m (10' 8") |
|
| July 27 |
22 | 3.4 m (11' 2") |
|
| August 11 |
24 | 3.6 m (11' 8") |
|
| October 30 |
9 | 2.1 m (7' 0") |
|
| 2013 | Water Temperature (°C) @ 1m | Water Clarity |
|
| May 20 |
18 | 2.4 m (8' 0") |
|
| June 9 |
19 | 3.0 m (9' 11") |
|
| July 3 |
23 | 2.8 m (9' 2") |
|
| August 5 |
22 | 3.1 m (10' 4") |
|
| October 27 |
6 | 1.5m (4' 11") |
|
| 2012 | Water Temperature (°C) @ 1m | Water Clarity |
|
| May 13 |
15 | 4.6 m (15' 2") |
|
| June 10 |
20 | 5.0 m (16' 4") |
|
| July 2 |
23 | 4.1 m (13' 6") |
|
| July 13 |
25 | 3.5 m (11' 5") |
|
| August 15 |
22 | 3.9 m (12' 9") |
|
| September 2 | 22 | 4.6 m (15' 2") |
|
| 2011 | Water Temperature (°C) @ 1m | Water Clarity |
|
| May 21 |
19 | 3.7 m (12' 2") |
|
| June 5 |
20 | 3.4 m (11' 2") |
|
| June 19 |
22 | 2.7 m (8' 9") |
|
| July 7 |
25 | 3.4 m (11' 2") |
|
| July 19 |
26 | 3.5 m (11' 6") |
|
| August 26 |
23 | 3.0 m (10' 0") |
|
| October 9 |
16 | 3.2 m (10' 6") |
|
| 2010 | Water Temperature (°C) @ 1m | Water Clarity |
|
| May 23 |
15 | 3.9 m (12' 9") |
|
| June 13 |
20 | 3.7 m (12' 2") |
|
| July 14 |
27 | 3.5 m (11' 6") |
A Monitor's Guide to Water Quality
This guide provides an introduction to some of the most important and commonly monitored aspects of water quality. Alongside local, place-based, and Traditional/Indigenous knowledge, this information can support decision-making and action to help protect our waters, so they remain healthy for generations to come.
Understanding Water Quality: What Are We Measuring in Our Lakes and Rivers?
Water may look clear and clean, but its appearance alone cannot tell us everything about its quality. Understanding the health of a lake or river requires looking at a variety of physical, chemical and biological measurements. Each one provides different information about the water, the conditions aquatic life depends on, and the possible presence of pollution.
Water quality can be influenced by natural processes, including the breakdown of rocks and soil, seasonal temperature changes and decaying organic matter. Human activities can also affect it through road salt, sewage, agricultural runoff, mining, fuel spills and the release of chemicals into the environment.
Here is a closer look at the measurements used to understand water quality and what they can tell us about the health of our freshwater ecosystems.
1. Water Clarity, Colour and Physical Conditions
The appearance of water can offer useful clues about what is happening beneath the surface. Several measurements help explain why water looks clear, cloudy, brown or green, and how these conditions affect aquatic life.
Turbidity
Turbidity measures how cloudy or murky water is because of tiny particles suspended in it. These particles may include algae, plant material, soil, silt, clay, salts, minerals and metals. Heavy rainfall, soil erosion, snowmelt, windstorms and fires can increase turbidity. Lakes may also become more turbid during summer as algae and aquatic animals grow and become more active. Cloudy water blocks sunlight, making it harder for underwater plants and algae to grow. Suspended particles can also interfere with fish feeding, clog fish gills and bury fish eggs. Harmful bacteria and pollutants may attach themselves to these particles. Turbidity can be measured directly in the water using a sensor or by testing a collected sample in a laboratory.
Secchi Depth (Water Transparency)
Secchi depth measures how far light penetrates into the water. A weighted, circular Secchi disc is lowered into the lake until it can no longer be seen. The depth at which the disc disappears provides an indication of water transparency. Water containing large amounts of algae, silt or other suspended material has a smaller Secchi depth because visibility is reduced. Water clarity matters because aquatic plants need sunlight to grow. The amount of light reaching underwater plants influences how much life a lake or river can support. Measurements are normally taken from the shaded side of a boat, with repeated readings used to calculate an average.
Total Suspended Solids and Total Dissolved Solids
These measurements help identify the amount of material present in water. Total suspended solids are particles that remain behind when water passes through a filter. Total dissolved solids are substances small enough to pass through that filter. The material may include algae, organic matter, silt, clay, minerals, salts and metals. Suspended solids are closely related to turbidity. High levels can reduce sunlight penetration, interfere with plant growth, clog fish gills and bury fish eggs. Dissolved solids are often made up of minerals and salts. Their levels are related to measurements such as conductivity, salinity, alkalinity and hardness. High concentrations can be difficult for freshwater fish and aquatic insects to tolerate. Both measurements are usually determined by filtering a water sample in a laboratory.
Water Colour
Water colour depends on the substances dissolved or suspended in it.
Water Temperature
Temperature affects how water mixes, how much oxygen it can hold and where different plants and animals can survive. Some lakes develop distinct layers of water at different temperatures, a process called thermal stratification. The timing and extent of this layering depend on seasonal patterns, lake size and climate. Cold water can hold more dissolved oxygen than warm water. Some fish depend on access to colder water in deeper areas or where groundwater enters a lake. If the water becomes too warm, these fish may not survive. Smaller, shallower lakes and streams can change temperature more quickly than larger bodies of water. Low water flow can also affect river temperatures, particularly during warm, dry periods. Temperature is best measured directly in the water with a thermometer or temperature sensor. Because lakes do not always mix completely, readings at several depths can provide a more complete picture.
Turbidity
Turbidity measures how cloudy or murky water is because of tiny particles suspended in it. These particles may include algae, plant material, soil, silt, clay, salts, minerals and metals. Heavy rainfall, soil erosion, snowmelt, windstorms and fires can increase turbidity. Lakes may also become more turbid during summer as algae and aquatic animals grow and become more active. Cloudy water blocks sunlight, making it harder for underwater plants and algae to grow. Suspended particles can also interfere with fish feeding, clog fish gills and bury fish eggs. Harmful bacteria and pollutants may attach themselves to these particles. Turbidity can be measured directly in the water using a sensor or by testing a collected sample in a laboratory.
Secchi Depth (Water Transparency)
Secchi depth measures how far light penetrates into the water. A weighted, circular Secchi disc is lowered into the lake until it can no longer be seen. The depth at which the disc disappears provides an indication of water transparency. Water containing large amounts of algae, silt or other suspended material has a smaller Secchi depth because visibility is reduced. Water clarity matters because aquatic plants need sunlight to grow. The amount of light reaching underwater plants influences how much life a lake or river can support. Measurements are normally taken from the shaded side of a boat, with repeated readings used to calculate an average.
Total Suspended Solids and Total Dissolved Solids
These measurements help identify the amount of material present in water. Total suspended solids are particles that remain behind when water passes through a filter. Total dissolved solids are substances small enough to pass through that filter. The material may include algae, organic matter, silt, clay, minerals, salts and metals. Suspended solids are closely related to turbidity. High levels can reduce sunlight penetration, interfere with plant growth, clog fish gills and bury fish eggs. Dissolved solids are often made up of minerals and salts. Their levels are related to measurements such as conductivity, salinity, alkalinity and hardness. High concentrations can be difficult for freshwater fish and aquatic insects to tolerate. Both measurements are usually determined by filtering a water sample in a laboratory.
Water Colour
Water colour depends on the substances dissolved or suspended in it.
- Brown water may result from dissolved organic matter or suspended sediment.
- Green water may indicate large amounts of algae.
- Brown, grey or light-blue water can result from suspended sediment.
- Other colours may be influenced by metal ions, pollution and other natural or human-made materials.
Water Temperature
Temperature affects how water mixes, how much oxygen it can hold and where different plants and animals can survive. Some lakes develop distinct layers of water at different temperatures, a process called thermal stratification. The timing and extent of this layering depend on seasonal patterns, lake size and climate. Cold water can hold more dissolved oxygen than warm water. Some fish depend on access to colder water in deeper areas or where groundwater enters a lake. If the water becomes too warm, these fish may not survive. Smaller, shallower lakes and streams can change temperature more quickly than larger bodies of water. Low water flow can also affect river temperatures, particularly during warm, dry periods. Temperature is best measured directly in the water with a thermometer or temperature sensor. Because lakes do not always mix completely, readings at several depths can provide a more complete picture.
2. Oxygen and the Chemical Balance of Water
Aquatic organisms depend on suitable oxygen levels and a stable chemical environment. Measurements of dissolved oxygen, pH, alkalinity and oxidation-reduction potential help us understand these conditions.
Dissolved Oxygen
Fish and other aquatic animals need oxygen dissolved in the water to breathe and survive. Oxygen levels are influenced by water temperature, depth, ice cover, water movement and the surrounding landforms. Very cold water generally holds more oxygen than very warm water. Low oxygen can occur after a long winter under ice or at the end of a hot summer when algae and other plants use up oxygen. Excess nutrients entering from sources such as sewage and farm runoff can also encourage excessive plant and bacterial growth, which consumes oxygen. When oxygen levels become too low, fish and other aquatic animals may struggle to survive. Dissolved oxygen is measured directly in the water using a specialized sensor.
pH
pH measures how acidic or basic water is on a scale from 0 to 14. Pure water is neutral, while lemon juice is an example of an acidic substance and soap is an example of a basic substance. Water pH can be affected by environmental conditions and pollution. Sulfur dioxide and nitrogen oxides in the air can react with water to form acid rain, which lowers the pH of lakes and rivers. Acidic conditions around mining sites can also affect nearby waterways. When water becomes too acidic, certain chemicals and metals dissolve more easily, potentially making them more toxic to fish and other organisms. Most fish prefer water with a pH between 6 and 8, and water that is too acidic or too basic can be fatal. pH can be measured using test strips or a probe placed directly in the water.
Alkalinity
Alkalinity measures water's ability to resist large changes in pH. It helps explain how stable the water's acidity or basicity is likely to remain. The surrounding rocks and soil influence alkalinity. Limestone-rich landscapes generally have higher alkalinity, while granite-rich landscapes can have lower alkalinity because granite lacks the minerals that increase alkalinity. Water with high alkalinity tends to have more stable pH levels, helping fish and other aquatic organisms thrive. When alkalinity is low, sudden changes caused by a chemical spill or large amounts of wastewater can alter pH rapidly. Alkalinity is typically measured by gradually adding small amounts of acid to a water sample until its pH drops sharply. The amount of acid required is used to calculate the alkalinity.
Oxidation-Reduction Potential (ORP)
Oxidation-reduction potential, or ORP, indicates the water's capacity to support chemical processes involved in breaking down waste and other materials. It depends partly on dissolved oxygen and is also influenced by substances such as sulfur, nitrate and iron. Oxygen helps bacteria decompose dead tissue and contaminants. Generally, a higher ORP indicates conditions that support these processes, while low ORP can indicate that dead and decaying material is not breaking down effectively. Such conditions can be toxic to fish and other aquatic life. ORP is measured using a sensor placed directly in the water. It is often measured alongside dissolved oxygen to help assess water quality and pollution levels.
Conductivity
Conductivity measures how easily electricity flows through water. Dissolved salts allow water to conduct electricity, and these salts can originate from the natural breakdown of rocks. Each lake or stream tends to have a relatively consistent range of conductivity. The type of surrounding rocks and soil influences this range, and conductivity also increases as water warms. Changes outside a water body's typical range can indicate pollution and may help suggest its source. For example, road salt or sewage can increase conductivity, while an oil spill might decrease it. Conductivity is measured using a probe placed directly in the water.
Hardness
Water hardness measures the amount of dissolved minerals, primarily calcium and magnesium. The surrounding geology plays an important role. Limestone contains calcium, which can enter water as the rock breaks down. Other rocks contain less calcium and magnesium and may erode less easily, resulting in softer water. Groundwater often has greater hardness than surface water because it remains in contact with rocks and minerals for longer periods. Hardness is also important because it can make some metals less toxic to aquatic plants and animals. It is measured by collecting a water sample and sending it to a laboratory.
Dissolved Oxygen
Fish and other aquatic animals need oxygen dissolved in the water to breathe and survive. Oxygen levels are influenced by water temperature, depth, ice cover, water movement and the surrounding landforms. Very cold water generally holds more oxygen than very warm water. Low oxygen can occur after a long winter under ice or at the end of a hot summer when algae and other plants use up oxygen. Excess nutrients entering from sources such as sewage and farm runoff can also encourage excessive plant and bacterial growth, which consumes oxygen. When oxygen levels become too low, fish and other aquatic animals may struggle to survive. Dissolved oxygen is measured directly in the water using a specialized sensor.
pH
pH measures how acidic or basic water is on a scale from 0 to 14. Pure water is neutral, while lemon juice is an example of an acidic substance and soap is an example of a basic substance. Water pH can be affected by environmental conditions and pollution. Sulfur dioxide and nitrogen oxides in the air can react with water to form acid rain, which lowers the pH of lakes and rivers. Acidic conditions around mining sites can also affect nearby waterways. When water becomes too acidic, certain chemicals and metals dissolve more easily, potentially making them more toxic to fish and other organisms. Most fish prefer water with a pH between 6 and 8, and water that is too acidic or too basic can be fatal. pH can be measured using test strips or a probe placed directly in the water.
Alkalinity
Alkalinity measures water's ability to resist large changes in pH. It helps explain how stable the water's acidity or basicity is likely to remain. The surrounding rocks and soil influence alkalinity. Limestone-rich landscapes generally have higher alkalinity, while granite-rich landscapes can have lower alkalinity because granite lacks the minerals that increase alkalinity. Water with high alkalinity tends to have more stable pH levels, helping fish and other aquatic organisms thrive. When alkalinity is low, sudden changes caused by a chemical spill or large amounts of wastewater can alter pH rapidly. Alkalinity is typically measured by gradually adding small amounts of acid to a water sample until its pH drops sharply. The amount of acid required is used to calculate the alkalinity.
Oxidation-Reduction Potential (ORP)
Oxidation-reduction potential, or ORP, indicates the water's capacity to support chemical processes involved in breaking down waste and other materials. It depends partly on dissolved oxygen and is also influenced by substances such as sulfur, nitrate and iron. Oxygen helps bacteria decompose dead tissue and contaminants. Generally, a higher ORP indicates conditions that support these processes, while low ORP can indicate that dead and decaying material is not breaking down effectively. Such conditions can be toxic to fish and other aquatic life. ORP is measured using a sensor placed directly in the water. It is often measured alongside dissolved oxygen to help assess water quality and pollution levels.
Conductivity
Conductivity measures how easily electricity flows through water. Dissolved salts allow water to conduct electricity, and these salts can originate from the natural breakdown of rocks. Each lake or stream tends to have a relatively consistent range of conductivity. The type of surrounding rocks and soil influences this range, and conductivity also increases as water warms. Changes outside a water body's typical range can indicate pollution and may help suggest its source. For example, road salt or sewage can increase conductivity, while an oil spill might decrease it. Conductivity is measured using a probe placed directly in the water.
Hardness
Water hardness measures the amount of dissolved minerals, primarily calcium and magnesium. The surrounding geology plays an important role. Limestone contains calcium, which can enter water as the rock breaks down. Other rocks contain less calcium and magnesium and may erode less easily, resulting in softer water. Groundwater often has greater hardness than surface water because it remains in contact with rocks and minerals for longer periods. Hardness is also important because it can make some metals less toxic to aquatic plants and animals. It is measured by collecting a water sample and sending it to a laboratory.
3. Nutrients and Algae
Nutrients are essential for plant growth, but excessive amounts can upset the balance of a freshwater ecosystem. Nitrogen, phosphorus and chlorophyll measurements help us understand nutrient levels and the potential for excessive algae growth.
Nitrogen
Nitrogen is an important nutrient for plant growth. It can be dissolved in water, attached to suspended particles or found in living organisms. Sources of nitrogen include agricultural runoff, septic systems, soil erosion, sewage and stormwater carrying pollutants from urban areas. Some forms of nitrogen can be toxic to aquatic organisms, depending on their concentration, the water's pH and its temperature. Too much nitrogen, particularly when combined with excess phosphorus, can encourage excessive algae growth. When algae and other plant material decompose, oxygen levels can fall, making it difficult for aquatic life to survive. Nitrogen is measured in laboratory water samples. Identifying the form of nitrogen being measured is important because different forms behave differently and have different effects on water quality.
Phosphorus
Phosphorus is another essential nutrient for aquatic plants. It enters waterways naturally through the erosion of rocks and soil and the breakdown of organic material. Sewage, agricultural runoff and fertilizers can increase phosphorus levels. Too much phosphorus can cause excessive algae and plant growth. These blooms can reduce oxygen levels and contribute to fish deaths. An additional concern is that phosphorus can become trapped in lake-bottom sediments and be released back into the water over many years. This means the effects of excessive phosphorus entering a lake may continue long after the original source has been reduced. Managing phosphorus inputs is therefore important to maintaining suitable habitat for fish, aquatic insects and other organisms. Phosphorus is measured in laboratory samples, and it is important to identify which form is being tested because different forms have different effects on water quality.
Chlorophyll
Chlorophyll is the green pigment that plants and blue-green algae use to capture sunlight and produce energy. Measuring chlorophyll helps estimate the amount of plant life in a lake or river. Higher chlorophyll levels can indicate greater amounts of algae. Algae are a natural and essential part of freshwater ecosystems, but excessive growth can be harmful. When large blooms decompose, they consume oxygen in the water. Some types of algal blooms can also produce toxins harmful to fish and people. Nutrients entering the water from sources such as sewage and agriculture can contribute to increased algae growth. Chlorophyll can be measured using a specialized sensor or through laboratory analysis of a water sample. Levels are usually highest in summer and lowest in winter, making seasonal monitoring important.
Nitrogen
Nitrogen is an important nutrient for plant growth. It can be dissolved in water, attached to suspended particles or found in living organisms. Sources of nitrogen include agricultural runoff, septic systems, soil erosion, sewage and stormwater carrying pollutants from urban areas. Some forms of nitrogen can be toxic to aquatic organisms, depending on their concentration, the water's pH and its temperature. Too much nitrogen, particularly when combined with excess phosphorus, can encourage excessive algae growth. When algae and other plant material decompose, oxygen levels can fall, making it difficult for aquatic life to survive. Nitrogen is measured in laboratory water samples. Identifying the form of nitrogen being measured is important because different forms behave differently and have different effects on water quality.
Phosphorus
Phosphorus is another essential nutrient for aquatic plants. It enters waterways naturally through the erosion of rocks and soil and the breakdown of organic material. Sewage, agricultural runoff and fertilizers can increase phosphorus levels. Too much phosphorus can cause excessive algae and plant growth. These blooms can reduce oxygen levels and contribute to fish deaths. An additional concern is that phosphorus can become trapped in lake-bottom sediments and be released back into the water over many years. This means the effects of excessive phosphorus entering a lake may continue long after the original source has been reduced. Managing phosphorus inputs is therefore important to maintaining suitable habitat for fish, aquatic insects and other organisms. Phosphorus is measured in laboratory samples, and it is important to identify which form is being tested because different forms have different effects on water quality.
Chlorophyll
Chlorophyll is the green pigment that plants and blue-green algae use to capture sunlight and produce energy. Measuring chlorophyll helps estimate the amount of plant life in a lake or river. Higher chlorophyll levels can indicate greater amounts of algae. Algae are a natural and essential part of freshwater ecosystems, but excessive growth can be harmful. When large blooms decompose, they consume oxygen in the water. Some types of algal blooms can also produce toxins harmful to fish and people. Nutrients entering the water from sources such as sewage and agriculture can contribute to increased algae growth. Chlorophyll can be measured using a specialized sensor or through laboratory analysis of a water sample. Levels are usually highest in summer and lowest in winter, making seasonal monitoring important.
4. Salts and Other Substances in Water
Some substances occur naturally in lakes and rivers, while others enter through human activities. Measuring chloride, salinity and various contaminants can help identify potential threats to freshwater ecosystems.
Chloride
Chloride is a component of salt found naturally in water. It can originate from rocks and soil, but human activities such as winter road salting and some mining operations can increase its concentration. Excess chloride can harm freshwater plants, aquatic insects and fish. Because chloride does not break down, it can accumulate in lakes and rivers over time. Chloride is generally measured by collecting water samples and testing them in a laboratory. In lakes, concentrations can vary with depth, so measurements at several depths can provide a better understanding of conditions.
Salinity
Salinity measures how salty water is, based on the concentration of dissolved ions. These include chloride, calcium, magnesium, sodium, potassium, carbonate and bicarbonate. Freshwater organisms are adapted to the conditions in their environment. A substantial increase in salinity can harm or kill freshwater fish and aquatic insects, and highly saline water may be unsafe to drink. Road salt washing into waterways, low rainfall, agricultural irrigation and hot weather can all contribute to increased salinity. As water evaporates, dissolved ions remain behind, increasing the concentration of salts. Salinity is measured with a sensor placed in the water. Because concentrations can vary at different depths, measurements throughout the water column are important.
Pharmaceuticals and Personal Care Products
Pharmaceuticals and personal care products include medicines, antibiotics, pain relievers, antidepressants, hormonal drugs, fragrances, detergents, caffeine, cosmetics and insect repellents. These substances can enter freshwater and marine environments when products are flushed down toilets or washed down sinks and showers. Wastewater systems do not always remove them effectively. Medicines used in farmed animals and fish can also reach rivers and lakes. The full effects of these substances on aquatic ecosystems are not yet completely understood. However, hormonal drugs can interfere with reproduction in fish and frogs. Some products can accumulate in the tissues of aquatic organisms, potentially causing ongoing damage throughout the food chain. Antibiotics entering the environment can also contribute to antibiotic resistance. Testing requires water or sediment samples that are sent to a laboratory for analysis.
Pesticides
Pesticides are used to control organisms considered pests, including insects, bacteria, fungi, plants and animals. Although pesticides are intended to affect target organisms, they can also affect other living things. Their toxicity varies: Some are harmful only at high concentrations, while others can be toxic even at low concentrations. Some pesticides accumulate in the environment, sediments and the tissues of organisms over time. Others can evaporate and travel on wind currents, potentially reaching lakes and rivers far from where they were applied. Pesticides can be measured in water, sediment and the tissues of aquatic organisms. Samples must be sent to a laboratory for analysis.
Hydrocarbons
Hydrocarbons are compounds made up of hydrogen and carbon. They originate from ancient plant material, algae and other living things and are commonly used as fuels. Crude oil contains hydrocarbons and other materials, including metals. It can be processed into fuels, plastics and cleaning products. Some hydrocarbons can harm aquatic ecosystems and human health. Several are considered probable causes of cancer, DNA changes and birth problems in fish and other animals. Testing can involve water, soil and sometimes animal tissues, including fish. Samples are sent to a laboratory for analysis.
Chloride
Chloride is a component of salt found naturally in water. It can originate from rocks and soil, but human activities such as winter road salting and some mining operations can increase its concentration. Excess chloride can harm freshwater plants, aquatic insects and fish. Because chloride does not break down, it can accumulate in lakes and rivers over time. Chloride is generally measured by collecting water samples and testing them in a laboratory. In lakes, concentrations can vary with depth, so measurements at several depths can provide a better understanding of conditions.
Salinity
Salinity measures how salty water is, based on the concentration of dissolved ions. These include chloride, calcium, magnesium, sodium, potassium, carbonate and bicarbonate. Freshwater organisms are adapted to the conditions in their environment. A substantial increase in salinity can harm or kill freshwater fish and aquatic insects, and highly saline water may be unsafe to drink. Road salt washing into waterways, low rainfall, agricultural irrigation and hot weather can all contribute to increased salinity. As water evaporates, dissolved ions remain behind, increasing the concentration of salts. Salinity is measured with a sensor placed in the water. Because concentrations can vary at different depths, measurements throughout the water column are important.
Pharmaceuticals and Personal Care Products
Pharmaceuticals and personal care products include medicines, antibiotics, pain relievers, antidepressants, hormonal drugs, fragrances, detergents, caffeine, cosmetics and insect repellents. These substances can enter freshwater and marine environments when products are flushed down toilets or washed down sinks and showers. Wastewater systems do not always remove them effectively. Medicines used in farmed animals and fish can also reach rivers and lakes. The full effects of these substances on aquatic ecosystems are not yet completely understood. However, hormonal drugs can interfere with reproduction in fish and frogs. Some products can accumulate in the tissues of aquatic organisms, potentially causing ongoing damage throughout the food chain. Antibiotics entering the environment can also contribute to antibiotic resistance. Testing requires water or sediment samples that are sent to a laboratory for analysis.
Pesticides
Pesticides are used to control organisms considered pests, including insects, bacteria, fungi, plants and animals. Although pesticides are intended to affect target organisms, they can also affect other living things. Their toxicity varies: Some are harmful only at high concentrations, while others can be toxic even at low concentrations. Some pesticides accumulate in the environment, sediments and the tissues of organisms over time. Others can evaporate and travel on wind currents, potentially reaching lakes and rivers far from where they were applied. Pesticides can be measured in water, sediment and the tissues of aquatic organisms. Samples must be sent to a laboratory for analysis.
Hydrocarbons
Hydrocarbons are compounds made up of hydrogen and carbon. They originate from ancient plant material, algae and other living things and are commonly used as fuels. Crude oil contains hydrocarbons and other materials, including metals. It can be processed into fuels, plastics and cleaning products. Some hydrocarbons can harm aquatic ecosystems and human health. Several are considered probable causes of cancer, DNA changes and birth problems in fish and other animals. Testing can involve water, soil and sometimes animal tissues, including fish. Samples are sent to a laboratory for analysis.
5. Toxic Metals and Persistent Chemical Contaminants
Some contaminants are particularly concerning because they can remain in the environment, accumulate in sediments or living organisms, and move through the food chain.
Mercury and Methylmercury
Mercury is a toxic metal that occurs naturally through processes such as rock weathering, forest fires and volcanic activity. Human activities, including coal-fired power generation, waste incineration, mining and metal smelting, also release mercury into the atmosphere. Mercury can travel long distances before returning to land and water through rain and snow.In water, bacteria can convert mercury into methylmercury, a highly toxic form that aquatic organisms and fish absorb more easily. This process often occurs in low-oxygen environments, including lake bottoms and wetlands. Methylmercury accumulates in organisms over time and moves through the food chain. Mercury can damage the nervous systems of people and animals, making it important to monitor concentrations in water and fish to help assess whether fish are safe to eat. Testing requires careful collection of water or fish samples and laboratory analysis to avoid contamination.
Selenium
Selenium is a naturally occurring element found in many minerals, including rocks containing copper, zinc and lead.Human activities, particularly coal and metal mining and irrigation in selenium-rich soils, can increase the amount released into rivers and lakes. Selenium often accumulates in lake and river sediments. Under certain conditions, it can be released back into the water. It can also accumulate in living organisms over time, particularly in slow-moving streams. High selenium levels are toxic to aquatic organisms, fish and the birds and animals that eat them. In fish, selenium can affect reproduction and cause deformities. Water containing high levels of selenium should not be consumed. Selenium can be measured in water, sediment, fish tissues and other aquatic organisms through laboratory analysis.
Dioxins and Furans
Dioxins and furans are groups of chemicals released through burning, including forest fires, waste incineration, power generation and metal production. They can also be produced during the manufacture of certain chemicals, including pesticides. Historically, pulp and paper bleaching was a significant source of these chemicals in Canadian fresh water. Certain types are highly toxic to plants and animals, and exposure in humans can cause serious illnesses, including cancer. Dioxins and furans do not break down easily, so chemicals released in the past can remain in the environment today. They can accumulate in lake and river sediments and increase in concentration through the food chain, with higher levels often found in large fish and mammals. Testing involves laboratory analysis of water, sediment and the tissues of organisms such as fish.
Polychlorinated Biphenyls (PCBs)
PCBs are highly toxic, human-made chemicals that were widely used in electrical and commercial products, including fluorescent lighting, before being banned in Canada in 1980. They do not break down easily and remain present in the environment. Leaks and spills can introduce them into water systems, while airborne PCBs can travel on air currents and return to land and waterways in rain and snow. PCBs are toxic to fish even at low concentrations and are likely to cause cancer in humans. They settle in lake and river sediments and accumulate in fish. Concentrations can increase as larger predatory fish consume smaller fish containing PCBs. PCBs can be measured in water, sediment and organisms such as fish through laboratory analysis.
Arsenic
Arsenic is a material found naturally in rocks and minerals. It can also enter the environment through human activities, including gold-mining operations. Arsenic is dangerous to aquatic life, particularly aquatic insects and algae, and can cause serious illness and cancer in people. The form arsenic takes in water depends on the amount of oxygen present and the surrounding materials. Microbes can change arsenic into forms that are more harmful because they are more easily absorbed by fish and other aquatic organisms. Arsenic can be measured by collecting water, groundwater, soil and air samples for laboratory testing.
Mercury and Methylmercury
Mercury is a toxic metal that occurs naturally through processes such as rock weathering, forest fires and volcanic activity. Human activities, including coal-fired power generation, waste incineration, mining and metal smelting, also release mercury into the atmosphere. Mercury can travel long distances before returning to land and water through rain and snow.In water, bacteria can convert mercury into methylmercury, a highly toxic form that aquatic organisms and fish absorb more easily. This process often occurs in low-oxygen environments, including lake bottoms and wetlands. Methylmercury accumulates in organisms over time and moves through the food chain. Mercury can damage the nervous systems of people and animals, making it important to monitor concentrations in water and fish to help assess whether fish are safe to eat. Testing requires careful collection of water or fish samples and laboratory analysis to avoid contamination.
Selenium
Selenium is a naturally occurring element found in many minerals, including rocks containing copper, zinc and lead.Human activities, particularly coal and metal mining and irrigation in selenium-rich soils, can increase the amount released into rivers and lakes. Selenium often accumulates in lake and river sediments. Under certain conditions, it can be released back into the water. It can also accumulate in living organisms over time, particularly in slow-moving streams. High selenium levels are toxic to aquatic organisms, fish and the birds and animals that eat them. In fish, selenium can affect reproduction and cause deformities. Water containing high levels of selenium should not be consumed. Selenium can be measured in water, sediment, fish tissues and other aquatic organisms through laboratory analysis.
Dioxins and Furans
Dioxins and furans are groups of chemicals released through burning, including forest fires, waste incineration, power generation and metal production. They can also be produced during the manufacture of certain chemicals, including pesticides. Historically, pulp and paper bleaching was a significant source of these chemicals in Canadian fresh water. Certain types are highly toxic to plants and animals, and exposure in humans can cause serious illnesses, including cancer. Dioxins and furans do not break down easily, so chemicals released in the past can remain in the environment today. They can accumulate in lake and river sediments and increase in concentration through the food chain, with higher levels often found in large fish and mammals. Testing involves laboratory analysis of water, sediment and the tissues of organisms such as fish.
Polychlorinated Biphenyls (PCBs)
PCBs are highly toxic, human-made chemicals that were widely used in electrical and commercial products, including fluorescent lighting, before being banned in Canada in 1980. They do not break down easily and remain present in the environment. Leaks and spills can introduce them into water systems, while airborne PCBs can travel on air currents and return to land and waterways in rain and snow. PCBs are toxic to fish even at low concentrations and are likely to cause cancer in humans. They settle in lake and river sediments and accumulate in fish. Concentrations can increase as larger predatory fish consume smaller fish containing PCBs. PCBs can be measured in water, sediment and organisms such as fish through laboratory analysis.
Arsenic
Arsenic is a material found naturally in rocks and minerals. It can also enter the environment through human activities, including gold-mining operations. Arsenic is dangerous to aquatic life, particularly aquatic insects and algae, and can cause serious illness and cancer in people. The form arsenic takes in water depends on the amount of oxygen present and the surrounding materials. Microbes can change arsenic into forms that are more harmful because they are more easily absorbed by fish and other aquatic organisms. Arsenic can be measured by collecting water, groundwater, soil and air samples for laboratory testing.
6. Bacteria and Other Indicators of Contamination
Some water quality tests focus on whether water may have been contaminated by human or animal waste.
Fecal Coliform Bacteria and E. coli
Coliform bacteria occur naturally in the intestines of birds and mammals, including humans, and are also found in soil. E. coli is one type of fecal coliform bacteria. Finding fecal coliform bacteria in water indicates contamination from human or animal waste. Possible sources include inadequately treated sewage, agricultural runoff and droppings from birds such as ducks and geese. E. coli and other fecal coliform bacteria can make people sick. Measuring these bacteria helps assess whether water is safe for drinking and recreational activities such as swimming. Bacterial levels can rise temporarily after unusually heavy rain washes contaminated material from stormwater or farm fields into waterways. If levels remain high, this may indicate that the water is being contaminated regularly. Water samples can be sent to a laboratory for testing. Some tests determine whether the bacteria are present, while others estimate their numbers by allowing them to grow.
Fecal Coliform Bacteria and E. coli
Coliform bacteria occur naturally in the intestines of birds and mammals, including humans, and are also found in soil. E. coli is one type of fecal coliform bacteria. Finding fecal coliform bacteria in water indicates contamination from human or animal waste. Possible sources include inadequately treated sewage, agricultural runoff and droppings from birds such as ducks and geese. E. coli and other fecal coliform bacteria can make people sick. Measuring these bacteria helps assess whether water is safe for drinking and recreational activities such as swimming. Bacterial levels can rise temporarily after unusually heavy rain washes contaminated material from stormwater or farm fields into waterways. If levels remain high, this may indicate that the water is being contaminated regularly. Water samples can be sent to a laboratory for testing. Some tests determine whether the bacteria are present, while others estimate their numbers by allowing them to grow.
7. Carbon: A Natural Part of Freshwater Ecosystems
Carbon is an essential element in all life on Earth. In lakes and rivers, it occurs in several forms: Dissolved gases, particles suspended in the water, sediments at the bottom, and living organisms. Carbon moves continuously through the environment, changing from one form to another. It provides energy and nutrients and influences nutrient and contaminant levels. Carbon can also help buffer the effects of acid rain by neutralizing acidity in water. Water flowing from the surrounding land can carry organic carbon into lakes and rivers, giving the water a brown tint. Carbon measurements can therefore help explain water colour as well as aspects of the ecosystem's chemistry. Carbon can be measured in water or sediment samples, and certain tests can help determine its source.
Why Regular Water Quality Monitoring Matters
No single measurement tells the whole story of a lake or river. Each provides a different piece of information: Water clarity and colour help us understand how much light reaches aquatic plants. Temperature and dissolved oxygen indicate whether conditions are suitable for fish and other aquatic animals. pH and alkalinity reveal information about the water's chemical balance, while conductivity, hardness, chloride and salinity help describe its dissolved substances. Nutrient measurements can identify conditions that favour excessive algae growth. Tests for bacteria can reveal contamination from human or animal waste, while analyses for pesticides, pharmaceuticals, metals and persistent chemicals can help identify substances that may harm aquatic ecosystems.
It is also important to consider how water conditions vary with depth and season. Temperature, oxygen, chloride, salinity and chlorophyll, for example, may not remain consistent throughout a lake or over the course of a year. Some measurements can be taken directly in the water using sensors. Others require water, sediment, soil or tissue samples to be collected and sent to a laboratory.
Together, these measurements provide a more complete understanding of freshwater conditions and help identify changes that may affect the plants, animals and people who depend on healthy lakes and rivers.