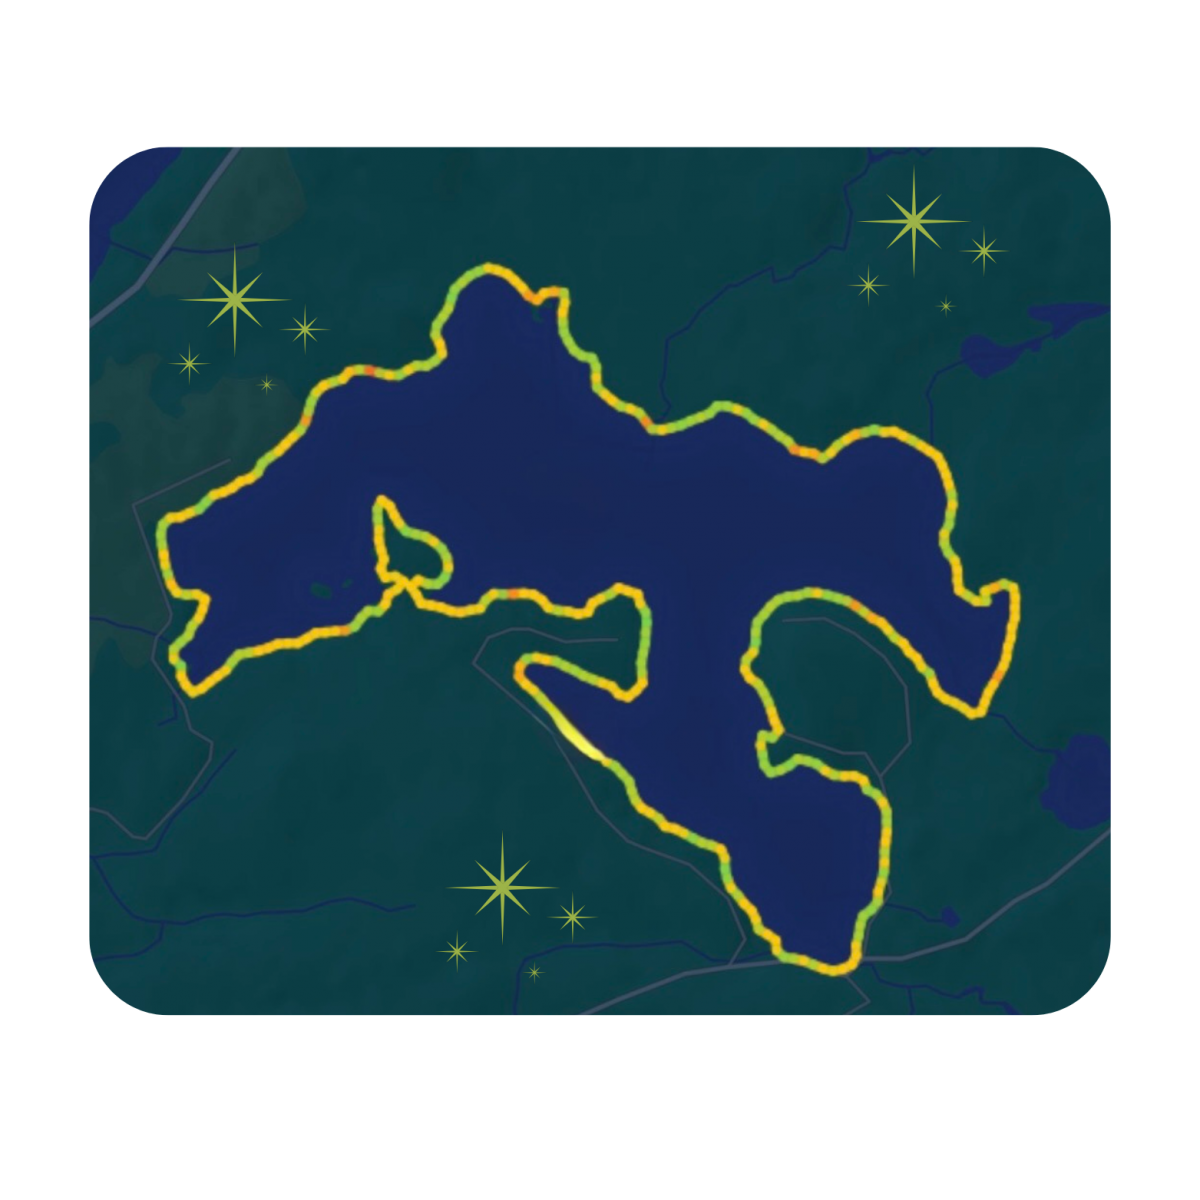
Lake Water Testing and Monitoring
The Echo Lake Association is involved in the following Citizen Science programs:
Ontario Lake Partner Program (LLP)
LPP is an arrangement between the Federation Of Ontario Cottagers’ Associations (FOCA), and the Ontario Ministry of Environment, Conservation and Parks (MECP) to conduct water-quality testing - Samples are tested for total phosphorus, calcium, chloride, and water clarity. Datasets are released to the volunteers, the public, researchers and other scientists.
The Lake Partner Program was featured in the Spring 2026 edition of the North American Lake Management Society's publication, LakeLine. Click HERE to read or download the article by FOCA's Lake Stewardship Coordinator, Gavin Vance.
To access LPP data:
Living Lakes Canada - National Lake Blitz
After 5 seasons of lake monitoring and community engagement across Canada, Living Lakes Canada has completed the National Lake Blitz project in 2025.
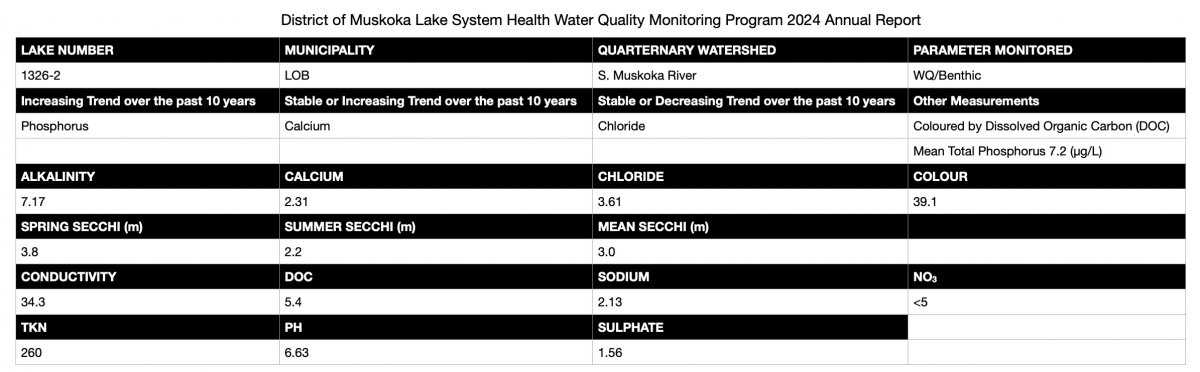
Using a combination of both of these water quality testing programs, the average results from 1997 to 2025 are:
NEW in 2025: Sulphate data
FYI: Echo Lake is considered VULNERABLE due to the blue-green algae bloom that occurred in 2019. That will continue to remain so.
* Average pH = 6.88 >> OKAY (s/b between 6.5 and 8.5)
* Average Phosphorous = 8.3 micrograms/L >> Oligotrophic - OKAY
* Average Secchi Depth (Clarity) = 3.38m >> Mesotrophic - OKAY
To learn more about trophic states visit: Limnology 101: Understanding Trophic States
To learn more about trophic states visit: Limnology 101: Understanding Trophic States
NEW in 2025: Sulphate data
The average sulphate level in Echo Lake since 2018 is 2.13 mg/L (sulphate levels in Canadian lakes typically range from 3 to 30 mg/L). Why does this matter? Sulphate is a key indicator of acid precipitation. The lower the sulphate level, the better.
FYI: Echo Lake is considered VULNERABLE due to the blue-green algae bloom that occurred in 2019. That will continue to remain so.
While Echo Lake seems to be holding its own, we CANNOT REST ON OUR LAURELS!
Member Laura Murray, a long-time cottager on the lake who’s studied wildlife biology and has been surveying the loons for Birds Canada for at least 25 years, made some very important comments at our 2023 Annual General Meeting that bears repeating here:
If we do get another bloom, one of the worst things we can do is break them. The danger is when boats break them, that just spreads it out and that's where the toxicity really takes hold.
The best ways to protect the lake is not to use fertilizers, keep septic systems in good operation, don’t use antibacterial soap because that kills the natural biology of the lake, keep a natural shoreline (leave fallen trees, and create a good depth of a buffer zone between a lawn, if you have one, and the shoreline). This is our best plan against another blue-green algae bloom and will keep our lake healthy for generations.
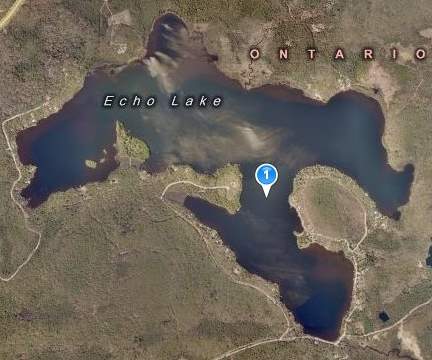
Pin indicates sample location for temperature and water clarity.
70-75 lakes, including Echo Lake, are sampled each year through the District of Muskoka's Recreational Water Quality Monitoring Program.
| 2025 | Water Temperature (°C) @ 1m | Water Clarity | |
|---|---|---|---|
| May 20 | 15 | 3.95 m (12.9’) | |
| June 3 | 16 | 2.85 m (9.5’) | |
| June 16 | 22 | 2.93 m (9.6’) | |
| July 16 | 33 | 3.35 m (11.0’) | |
| August 4 | 28 | 3.30 m (10.8’) | |
| August 13 | 29 | 3.90 m (12.8’) | |
| September 11 | 22 | 3.35 m (11.0’) | |
| 2024 | Water Temperature (oC) @ 1m | Water Clarity | |
| May 16 | 23 | 4.10 m (13.5’) | |
| June 20 | 26 | 3.60 m (11’8"’) | |
| June 26 | 28 | 2.65 m (8’7”) | |
| July 12 | 27 | 2.93 m (9’6”) | |
| July 22 | 25 | 2.85 m (9’4”) | |
| July 31 | 30 | 2.95 m (9’7”) | |
| August 13 | 24 | 3.35 m (11’) | |
| August 22 | 26 | 2.65 m (8’7”) | |
| November 28 | 1 | 2.45 m (8’0") | |
| 2023 | Water Temperature (°C) @ 1m | Water Clarity | |
| May 6 | 11 | 3.4 m (11' 4") | |
| May 29 | 20 | 4.3 m (14' 3") | |
| June 18 | 23 | 2.4 m (8' 0") | |
| July 7 | 25 | 2.9 m (9' 6") | |
| July 19 | 25 | 2.1 m (7' 0") | |
| August 11 | 24 | 2.6 m (8' 6") | |
| August 28 | n/a | 3.05 m (10') | |
| November 9 | n/a | 2.44 m (8') | |
| 2022 | Water Temperature (°C) @ 1m | Water Clarity | |
| May 22 | 18 | 2.9 m (9' 6") | |
| June 24 | n/a | 2.8 m (9' 1") | |
| July 19 | n/a | 3.2 m (10' 5") | |
| August 14 | n/a | 3.3 m (10' 10") | |
| August 26 | n/a | 3.4 m (11' 2") | |
| October 24 | 13 | 2.5 m (8'1")? | |
| 2021 |
Water Temperature (°C) @ 1m | Water Clarity | |
| May 24 | 18 | 3.3 m (11' 0") | |
| June 6 |
22 |
3.3 m (10' 11") |
|
| July 4 | 23 | 2.6 m (8' 6") | |
| September 11 | n/a | 2.7 m (8' 10") | |
| October 20 | 17 | 2.8 m (9' 2") | |
| 2020 | Water Temperature (°C) @ 1m | Water Clarity | |
| May 23 | 17 | 3.1 m (10' 3") | |
| June 4 | 19 | 3.7 m (12' 1") | |
| June 28 | 22 | 2.4 m (8' 0") | |
| September 11 | 18 | 3.2 m (10' 6") | |
| September 20 | 14 | 3.0 m (9' 10") | |
| November 9 | 8 | 2.9 m (9' 7") | |
| 2019 | Water Temperature (°C) @ 1m | Water Clarity | |
| May 16 | 12 | 2.8 m (9' 1") | |
| June 6 |
16 | 4.1 m (13' 5") | |
| June 23 | 23 | 3.6 m (12') | |
| July 22 |
26 | 3.8 m (12' 6") | |
| August 11 |
22 | 3.4 m (11' 2") | |
| August 26 |
24 | 2.8 m (9' 1") | |
| 2018 | Water Temperature (°C) @ 1m | Water Clarity | |
| May 12 | 13 | 3.3 m (10' 8") | |
| June 10 | 22 | 2.6 m (8' 6") | |
| June 17 | 24 | 2.9 m (9' 7") | |
| July 12 | 26 | 3.3 m (10' 11") | |
| July 23 | 25 | 2.5 m (8' 3") | |
| August 19 | 26 | 4.3 m (14' 1") | |
| 2017 | Water Temperature (°C) @ 1m | Water Clarity | |
| May 17 | 16 | 3.1 m (10' 1") | |
| June 3 | 18 | 3.1 m (10' 3") | |
| July 2 | 23 | 2.5 m (8' 1") | |
| July 27 | Not able to attain | 2.8 m (9' 3") | |
| September 21 | Not able to attain | 3.1 m (10' 2") | |
| 2016 | Water Temperature (°C) @ 1m | Water Clarity | |
| May 12 | 15 | 3.3 m (10' 9") | |
| July 6 | 24 | 4.2 m (13' 10") | |
| August 1 | N/A | 4.4 m (14' 7") | |
| September 16 | 16 | 3.9 m (12' 9") | |
| September 25 | 14 | 4.1 m (13' 6") | |
| 2015 | Water Temperature (°C) @ 1m | Water Clarity | |
| May 24 |
17 | 2.3 m (7' 8") |
|
| June 20 |
21 | 2.9 m (9' 6') |
|
| July 6 |
22 | 3.2 m (10' 5") |
|
| August 22 |
24 | 3.1 m (10' 2") |
|
| November 29 | 3 | 2.6 m (8' 6") |
|
| 2014 | Water Temperature (°C) @ 1m | Water Clarity |
|
| June 7 |
21 | 2.7 m (8' 11") |
|
| July 10 |
22 | 3.3 m (10' 8") |
|
| July 27 |
22 | 3.4 m (11' 2") |
|
| August 11 |
24 | 3.6 m (11' 8") |
|
| October 30 |
9 | 2.1 m (7' 0") |
|
| 2013 | Water Temperature (°C) @ 1m | Water Clarity |
|
| May 20 |
18 | 2.4 m (8' 0") |
|
| June 9 |
19 | 3.0 m (9' 11") |
|
| July 3 |
23 | 2.8 m (9' 2") |
|
| August 5 |
22 | 3.1 m (10' 4") |
|
| October 27 |
6 | 1.5m (4' 11") |
|
| 2012 | Water Temperature (°C) @ 1m | Water Clarity |
|
| May 13 |
15 | 4.6 m (15' 2") |
|
| June 10 |
20 | 5.0 m (16' 4") |
|
| July 2 |
23 | 4.1 m (13' 6") |
|
| July 13 |
25 | 3.5 m (11' 5") |
|
| August 15 |
22 | 3.9 m (12' 9") |
|
| September 2 | 22 | 4.6 m (15' 2") |
|
| 2011 | Water Temperature (°C) @ 1m | Water Clarity |
|
| May 21 |
19 | 3.7 m (12' 2") |
|
| June 5 |
20 | 3.4 m (11' 2") |
|
| June 19 |
22 | 2.7 m (8' 9") |
|
| July 7 |
25 | 3.4 m (11' 2") |
|
| July 19 |
26 | 3.5 m (11' 6") |
|
| August 26 |
23 | 3.0 m (10' 0") |
|
| October 9 |
16 | 3.2 m (10' 6") |
|
| 2010 | Water Temperature (°C) @ 1m | Water Clarity |
|
| May 23 |
15 | 3.9 m (12' 9") |
|
| June 13 |
20 | 3.7 m (12' 2") |
|
| July 14 |
27 | 3.5 m (11' 6") |